
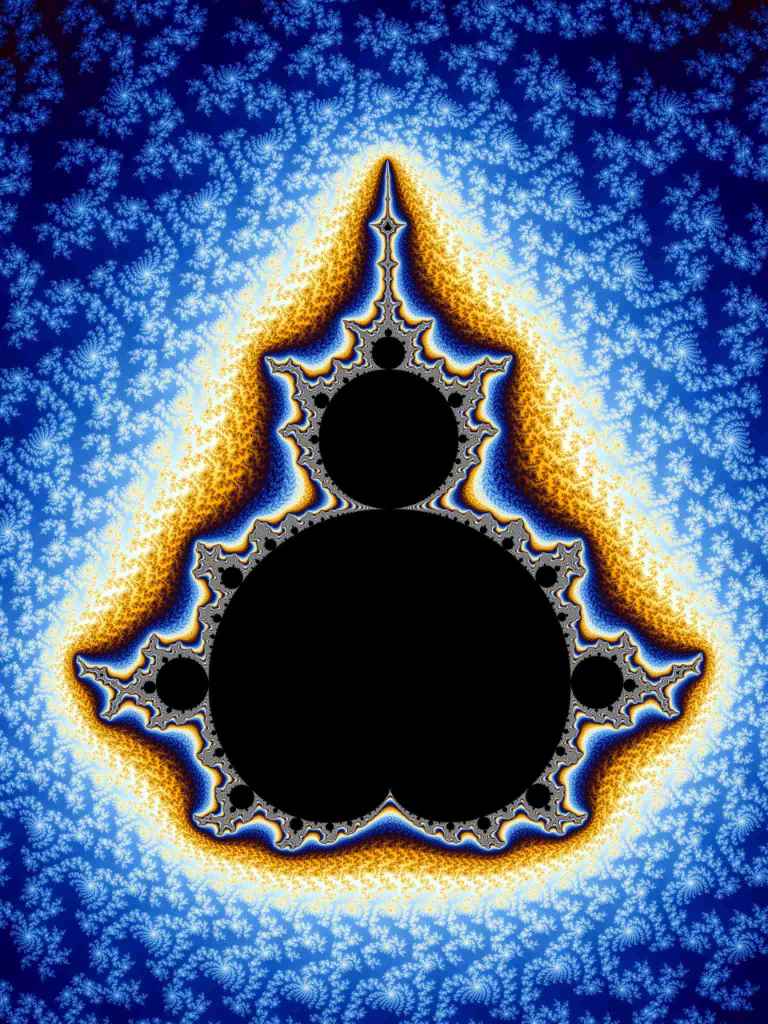
You know the beautiful images of the Mandelbrot-Set, like this one:
And you’ve probably heard that this is a purely mathematical “object”, generated with this simple formula:

How do you get from the formula to a picture?
It’s actually simple if you understand the meaning of the arrow that is used instead of =
It’s easiest when you see it in action, so let’s calculate the z->z²+c with c=1
z->z²+1 z always starts out as zero, so let’s add the 0 in.
0->0²+1 the result is 1.
Now we come to the arrow. It means that after calculating a first result, you take that result and use it as new value for z. So we change z to 1:
1->1²+1 result is 2. so for the next calculation (called “iteration”) we take 2 for z:
2->2²+1 result is 5, put back in for the next iteration:
5->5²+1 result is 26
26->26²+1 is 677
677->677²+1
458329->458329²+1 ….
There’s little point to continue this, it’s obvious the number will grow larger very fast.
The result of Mandelbrots formula is that for c=1 as starting value, it goes towards infinity.
All points that go towards infinity are NOT part of the Mandelbrot set.
But this doesn’t happen for all values. Let’s try a different example. how about c=-1
z->z²-1
1. Iteration 0->0²-1 result is -1, so we take -1 for z in the next iteration.
2. Iteration -1->-1²-1 result is so z=0 for the 3. iteration)
3. Iteration 0->0²-1 (result is -1 again, using z=-1 for the 4. iteration)
4. Iteration -1->-1²-1
5. Iteration 0->0²-1
6. Iteration -1->-1²-1
…
So for c=-1 Mandelbrots formula doesn’t grow to infinity but oscillates between -1 and 0.
All points that never go to infinity are part of the Mandelbrot-Set.
So where’s the picture?
Well, it is hard work to calculate this by hand and it would take years to manually calculate a detailed picture. We actually have calculated just 2 pixels of a Mandelbrot-Set image.
A full-HD picture has 1920*1080 = 2.073.600 Pixels. So it’s no wonder the Mandelbrot -Set was only discovered after computers became fast enough.
[slideshow_deploy id=’2001′]
For this simple explanation we’ll stick with the horizontal x-axis. For the vertical y-axis you need to understand imaginary numbers. To learn about them watch this video.
To visually play around with different values of c use this nice tool.
Iterations – how the Mandelbrot-Set becomes colorful
Remember the “iterations” from above?
The iterations are the number of repetitions needed to find out if a starting value goes to infinity.
As a rule of thumb, as soon as the result of a iteration is larger than 2, you can stop calculating, because all results over 2 will always go towards infinity and can never be a part of the Mandelbrot-Set. For c=1 the iteration-chain looked like this:
1. Iteration 0->0²+1
2. Iteration 1->1²+1 result is 2
3. Iteration 2->2²+1
With the second iteration it’s clear that the result will inevitably become larger and larger until infinity. So we can stop calculating and calculate the next pixel.
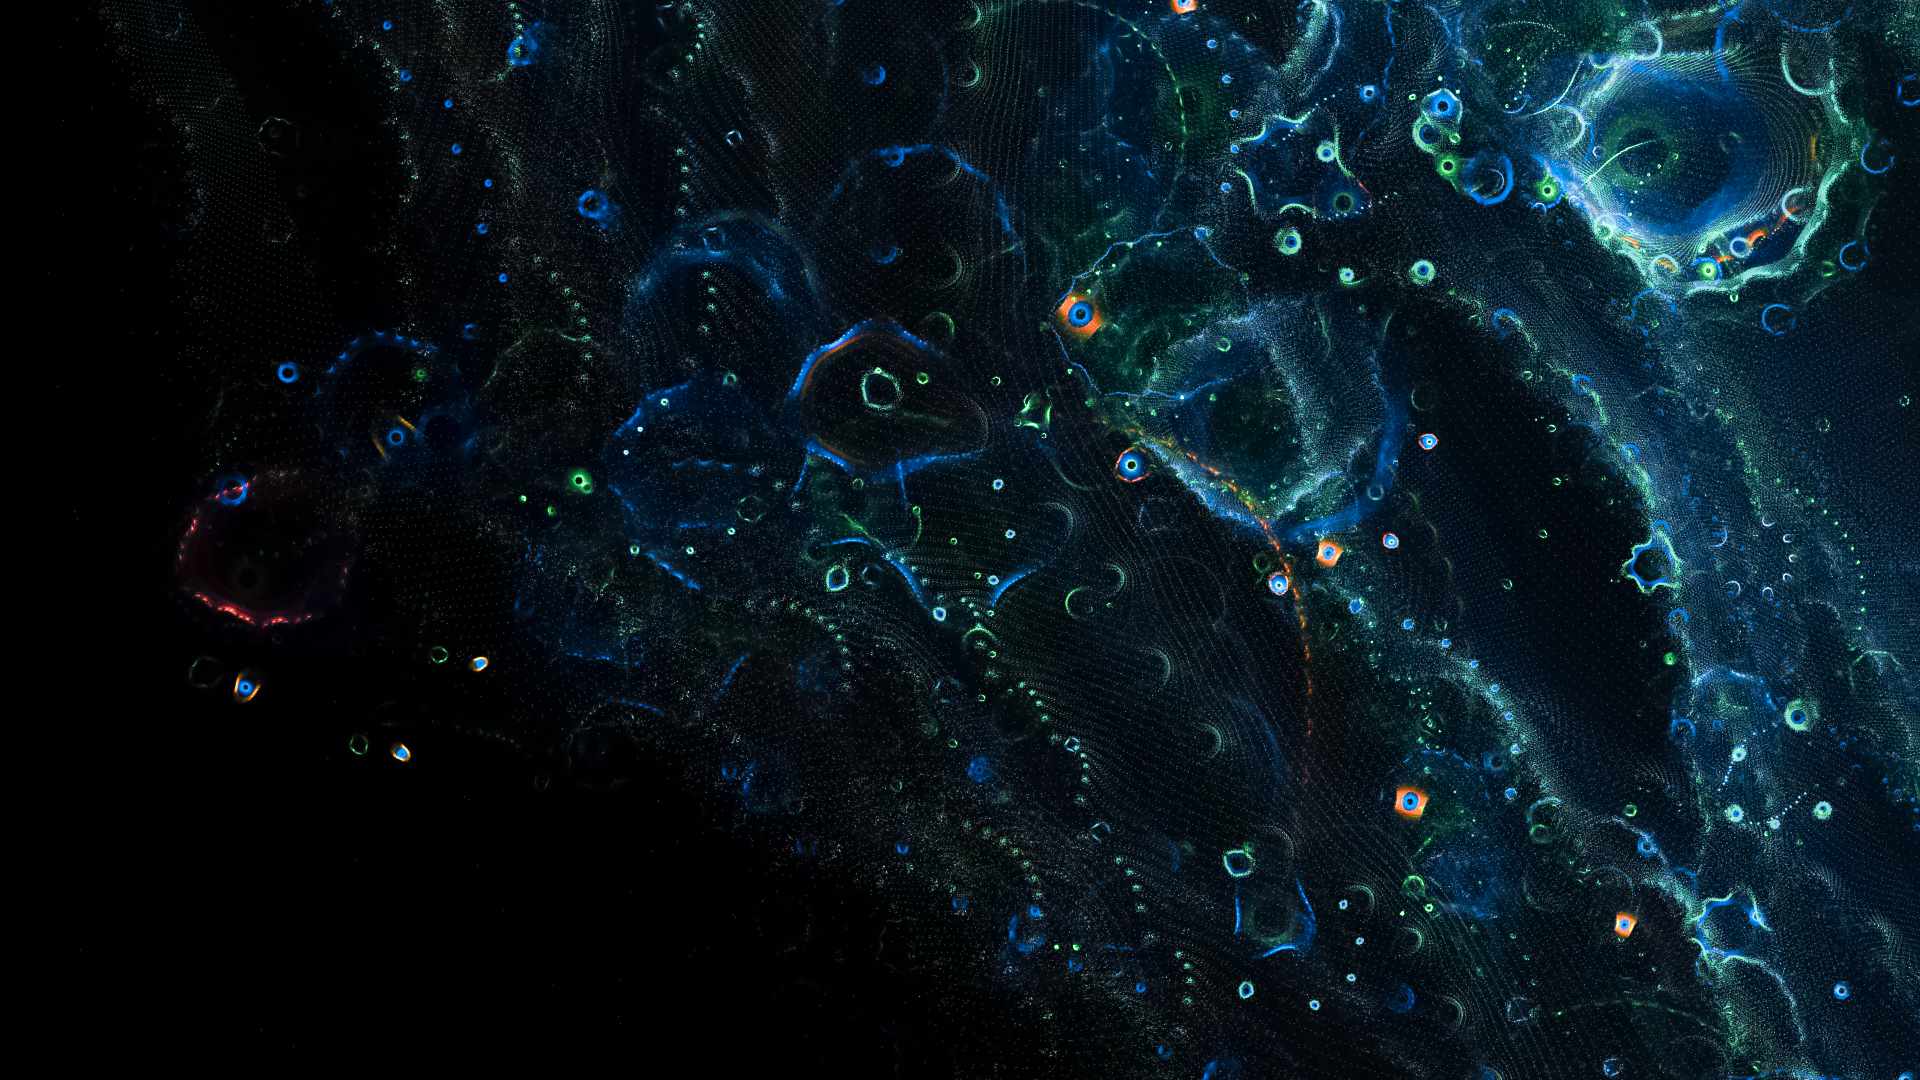
[slideshow_deploy id=’2005′]
In the last picture, the center of the miniature Mandelbrot set has c value of -0.272162760214080041615297
Just to make clear why only computers have “the patience” to calculate these images, lets do the first few iterations of a single pixel in the center by hand:
1. Iteration:
0->0²+-0.272162760214080041615297
2. Iteration
-0.272162760214080041615297->-0.272162760214080041615297²+(–0.272162760214080041615297)
3.Iteration
-0.346235328261426871634995444->-0.346235328261426871634995444²+(–0.272162760214080041615297)
4.Iteration
-0.392041662750378062980754096877->-0.392041662750378062980754096877²+(-0.272162760214080041615297
5. Iteration … nope. That’s enough. But we need to do all 1024 iterations before it becomes clear that c=-0.272162760214080041615297 is actually part of the Mandelbrot-Set and will therefor be coloured black.
Now you’re prepared to appreciate a deep zoom – not only for it’s beauty, but also the incredible mathematical task that simulation is. Just for comparison, zooming from the whole visible universe down to a single Planck length is a zoom depth of 10^62. This videos final zoom depth is 10^96, the final coordinates are:
Real: -1.77983107263358987710609737625462554160612202082973721464269536941106123136243079619230058357360213932827
Imaginary:
0.0000768808104690890642867866831207682698968739265086118371576831945033925898525759232427462136212757994983490243570012245
Zoomdepth: 1.068E96
No matter who, when or where, when these coordinates are put into Mandelbrots formula, the result will be this exact zoom path and final picture.
Infinite complexity from a simple formula – simple mathematics creating the most common features in nature, they are embedded this simple formula: z->z²+c
And just in case you wonder – the current world record for deepest zoom is this with a final zoom depth of 10 to the power of 10002.
It took 2 full months to render.
Great freeware to explore the beauty of the Mandelbrot Set on PC right now:
Download Kalles Fraktaler
Here you can download the location parameters of the above movie to load into Kalles Fraktaler.